

Trading Journal Spreadsheet | Stock, Options & Crypto Log (Google Sheets & Excel)
Google Sheets + Excel · Light & Dark Modes
Win Rate %, Profit Factor, Risk-Reward Ratio (R:R) & Equity Curve
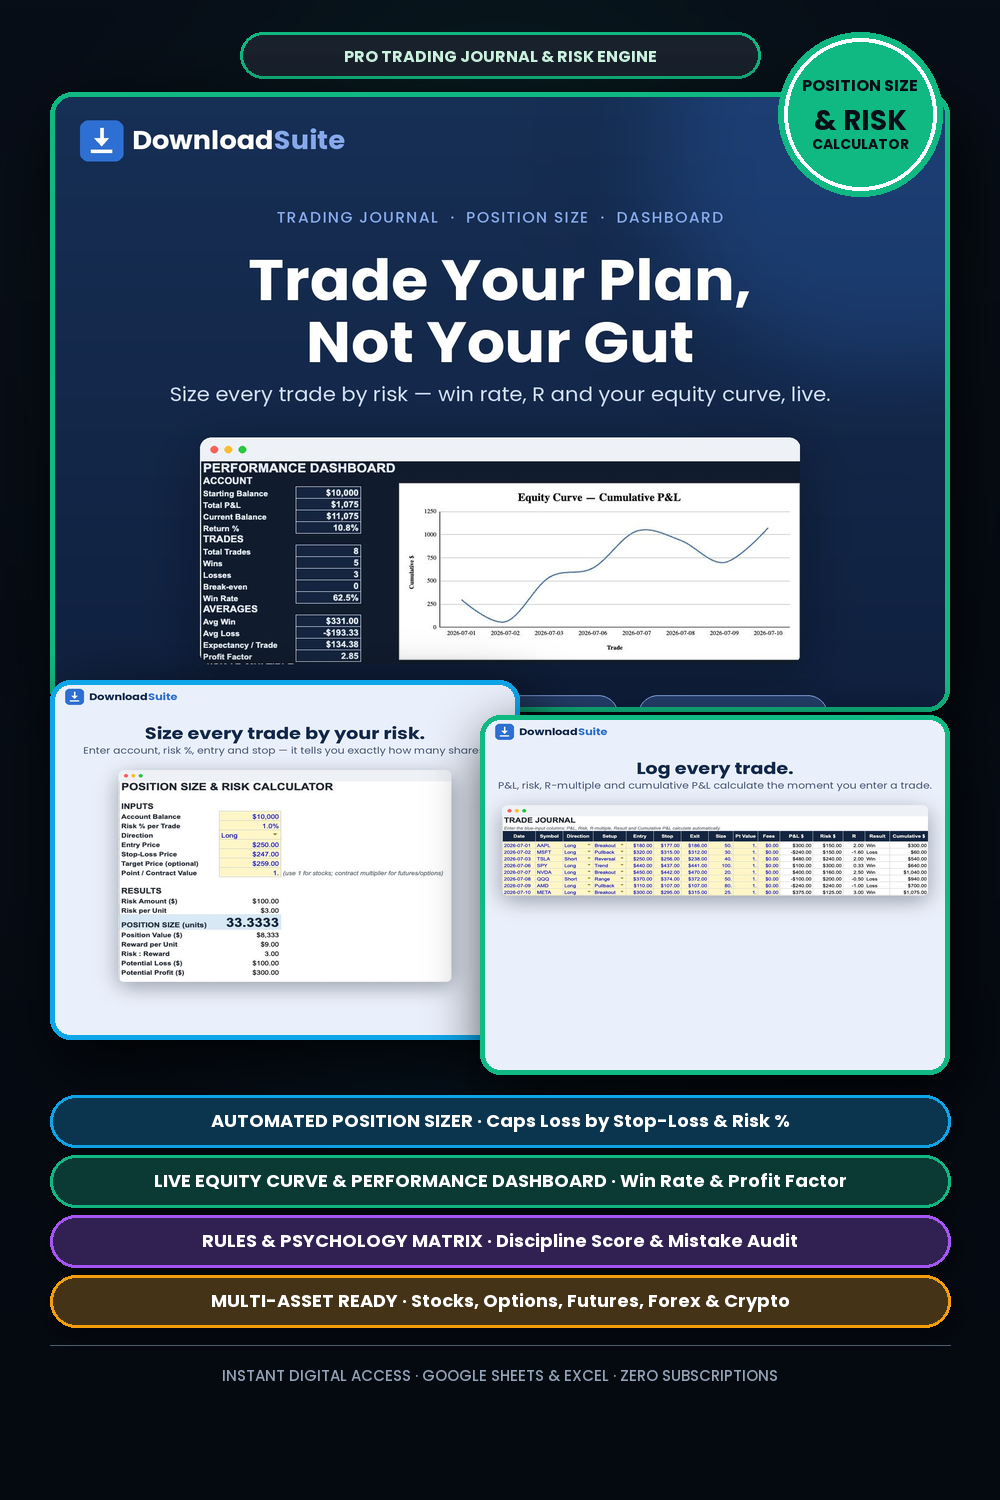
- Executive Trading Dashboard (Win Rate %, Profit Factor, Net P&L, Total Trades & Sharpe Ratio)
- Trade Execution Ledger (Track ticker, setup, long/short, entry, exit, size, stop loss & fees)
- Risk-Reward (R:R) & Position Sizing Calculator (Enforces strict risk management)
- Strategy Breakdown Analytics (Isolates your most profitable setups vs losing patterns)
- Visual Equity Curve & Monthly Cumulative P&L Progression Charts
- Trading Psychology & Mistake Tagging Matrix (FOMO, early exit, revenge trading, rule breaks)
- Light & Dark Mode Included (Google Sheets + Microsoft Excel)
Instant digital download. All sales final. Message us anytime for help.
Master trading psychology, track execution edge, and eliminate costly trading mistakes. The DownloadSuite Trading Journal Spreadsheet is a performance tracking command center for stock, options, futures, forex, and crypto traders, calculating win rate %, profit factor, risk-reward (R:R), drawdown, and equity curves.
What's Included in This System:
- Executive Trading Performance Dashboard: Real-time metrics for Win Rate %, Profit Factor, Net P&L, Total Trades, Average Win vs Loss Ratio, and Sharpe Ratio.
- Comprehensive Trade Execution Ledger: Log ticker, setup name, long/short direction, entry price, exit price, share/contract size, stop loss, take profit, and commission fees.
- Risk-Reward (R:R) & Position Sizing Calculator: Pre-trade calculator ensuring you maintain strict 2:1 or 3:1 risk-to-reward parameters.
- Strategy & Setup Win/Loss Analytics: Isolates which trading setups (e.g. Breakout, Pullback, Mean Reversion) generate positive expectancy vs losing setups.
- Visual Daily/Monthly Equity Curve Graphs: Cumulative P&L graphs tracking account balance progression and maximum drawdown.
- Psychology & Execution Mistake Tagging Matrix: Tag emotional errors (FOMO, early exit, revenge trading, oversized risk) to audit behavioral habits.
How to Use:
- Input your account starting balance and define your core trading setups on the Settings tab.
- Log your trades with entry, exit, position size, and stop loss.
- Review your Strategy Analytics and Equity Curve weekly to optimize your trading edge.
What's inside
- Start Here Quick-Start & Risk Management Rule Guide
- Master Trading Performance Command Center
- Trade Entry & Execution Log (Supports Stocks, Options, Forex & Crypto)
- Setup & Strategy Performance Matrix
- Daily & Monthly P&L Analytics with Visual Equity Curve
- Psychology & Trade Rule Execution Audit Sheet
- Instant Google Sheets Links + Native Excel .xlsx Workbooks
FAQ
What trading asset classes does this support?
It supports Equities/Stocks, Options (calls, puts, spreads), Futures, Forex, and Cryptocurrency trades.
How does the Profit Factor calculation work?
Profit Factor is automatically calculated as Gross Winning Dollars divided by Gross Losing Dollars to measure your trading system's mathematical edge.
Does it work in Excel and Google Sheets?
Yes! Both native Excel workbooks and Google Sheets copy links in Light and Dark themes are included.